


You’re getting traffic. Your ads are running. The sessions are there.
But the Shopify orders page is quiet.
If you’ve spent any time in the Shopify merchant community, you know this feeling. And if you’ve Googled “why am I not getting sales on Shopify,” you’ve probably been bombarded with advice that sounds something like: “Add better product photos!” or “Write more compelling copy!”
That advice isn’t wrong. But it’s almost never the real answer.
The stores we analyze with real user monitoring data — across thousands of merchants and hundreds of millions of sessions — tell a different story. The most common reasons Shopify stores get traffic without sales are technical and behavioral, not aesthetic. They’re invisible to the naked eye, hidden in network waterfall charts and JavaScript execution traces and session heatmaps.
This article covers all seven of them. We’ll use real data from our case studies, industry research from Google, Shopify, and Baymard Institute, and connect you to the specific tools and fixes for each one.
Start with a diagnosis, not a guess. Our free SEO Authority Checker pulls your domain’s real Core Web Vitals from Google’s CrUX database so you can see exactly what real users are experiencing before you change anything.
The Core Problem: Why “Good Traffic, No Sales” Happens
Before we get into the seven reasons, it’s important to understand the fundamental mechanism.
Most merchants look at this equation:
Traffic × Conversion Rate = Sales
They focus obsessively on increasing traffic (more ads, better SEO) while treating conversion rate as a fixed number. But conversion rate isn’t fixed — it’s a function of your store’s experience. And that experience varies wildly based on:
- What device your customer is using (mobile vs. desktop)
- How fast their connection is
- Which third-party apps are firing at the moment they’re trying to buy
- Whether your checkout button actually responds when they tap it
Here’s the uncomfortable truth from our data: Shopify stores lose a median of 6–10% of their potential revenue to performance and UX problems that are completely fixable. The revenue is sitting there. The traffic is there. The intent is there. The store is just failing to complete the transaction.
Your Funnel Is Telling You Where People Drop Off
Before anything else, look at your actual conversion funnel. Most merchants fixate on the final conversion rate number, but the funnel breakdown reveals where visitors are leaking out — and that’s a completely different problem to solve.
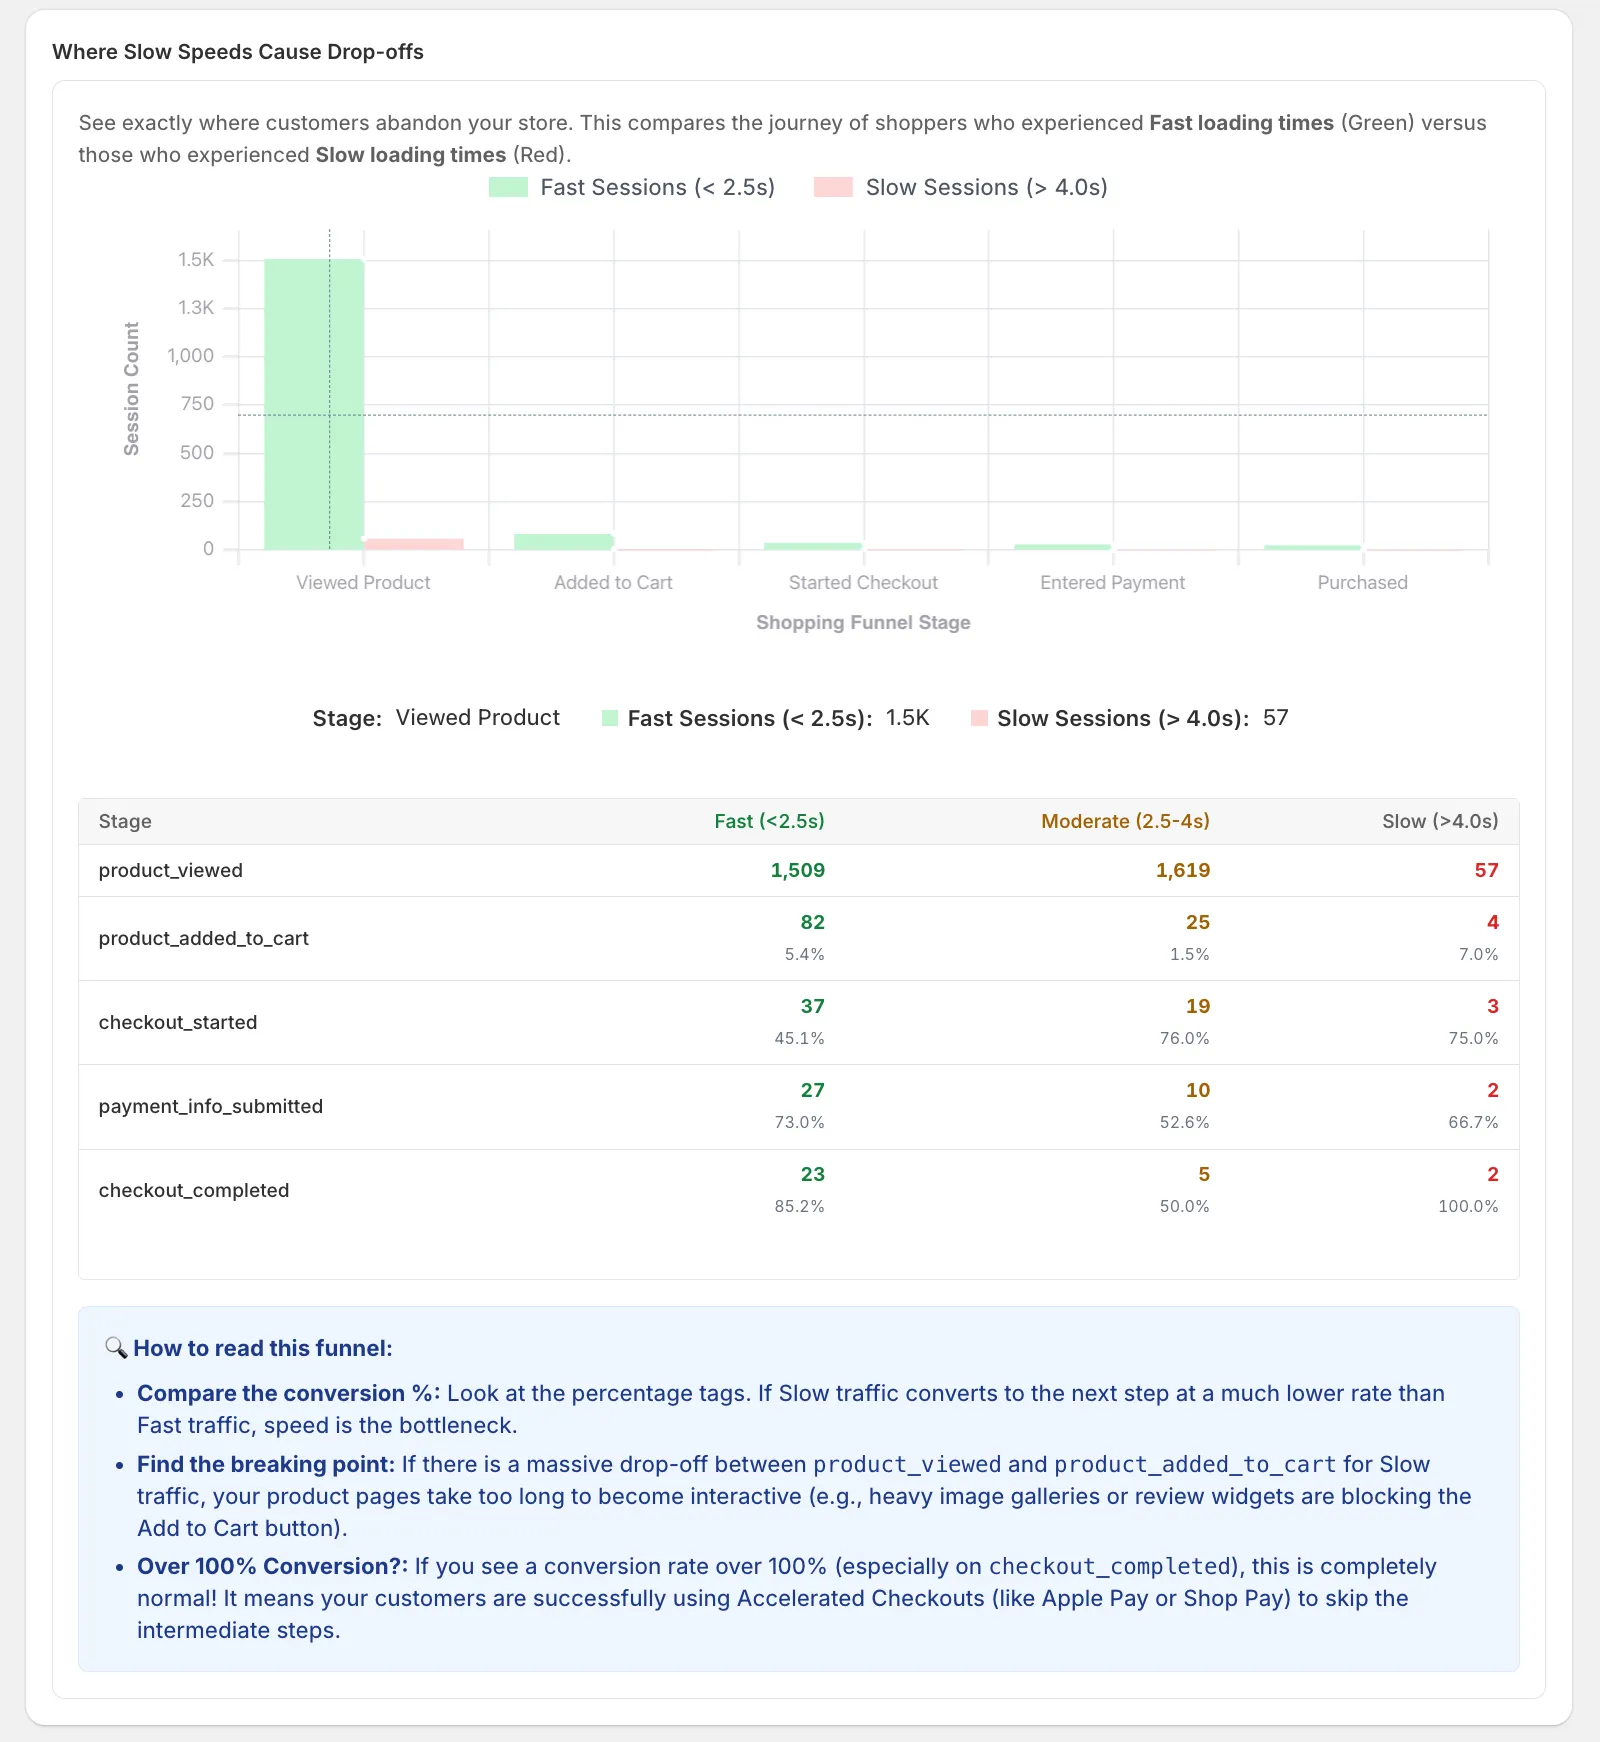
This is what a problematic funnel looks like: a large volume of sessions hitting your product pages, but only a fraction ever clicking “Add to Cart.” That gap — between visits and ATC — is the first place most stores bleed revenue. And it’s almost never because the product is wrong.
It’s because:
- The page loaded too slowly for mobile users to wait (they bounced before seeing the product)
- The layout shifted and they accidentally navigated away
- The “Add to Cart” button was unresponsive (a ghost checkout precursor)
- The in-app browser (Instagram, TikTok) broke the checkout experience before it even started
If you can see this drop-off pattern in your own data, Superspeed’s Session Funnel Intelligence identifies exactly which pages, devices, and session types are causing it — so you can fix the right problem instead of guessing.
Let’s look at each failure mode.
Reason 1: Your Store Is Too Slow on Mobile — And You’re Measuring the Wrong Metric
If you’ve checked your Shopify speed score or run a Google Lighthouse test and gotten a good number, stop. That number is not telling you what’s happening to your actual customers.
A Lighthouse test runs in a controlled lab environment: fast server, fast network, modern CPU, no third-party scripts firing in real time. Your actual customers — especially the 65–75% of Shopify traffic that comes from mobile devices — are shopping on mid-range Android phones on 4G networks in real-world conditions.
The metric that matters is Largest Contentful Paint (LCP): how long it takes the largest visible element on your page to actually render for a real user. Google’s threshold is 2.5 seconds. The median Shopify store, measured from real Chrome user data in Google’s CrUX database, has an LCP of approximately 3.8 seconds on mobile.
That’s not a speed problem. That’s a conversion problem.
Research from Google’s own data science team found that as page load time goes from 1s to 3s, the probability of a mobile visitor bouncing increases by 32%. From 1s to 5s, it increases by 90%. And these aren’t theoretical users — they’re people who clicked your ad, visited your store, and left before they ever saw your product properly.
What This Looks Like in Real Money
Mamma Mia Covers, a Shopify store generating $413,000 in tracked monthly revenue, used our Revenue Impact Analysis tool to measure what their slow mobile sessions were actually costing them.
The data was stark:
- Sessions with fast-loading pages: $6.05 revenue per session
- Sessions with slow-loading pages: $3.92 revenue per session
That performance gap translated to an identified monthly revenue leak of $33,542 — every single month, just from pages that were loading slowly on mobile.
Similarly, Sheffield Pottery analyzed 103,659 sessions and found that their “poor” performance sessions (11,112 of them) were converting at a rate so low it represented a $9,720 monthly revenue leak and a projected +9.84% conversion uplift if fixed.
The Fix
The #1 cause of slow Shopify LCP on mobile is the hero image. Most Shopify themes load it using a standard <img> tag, which means the browser has to download the HTML, parse it, discover the image URL, and then start the download. This creates a 400–800ms unnecessary delay.
Adding a single <link rel="preload"> tag in your theme’s <head> tells the browser to start downloading the hero image immediately — often cutting LCP by 0.5–1.5 seconds with zero risk.
Use our free LCP Preload Generator to generate the exact tag for your theme.
The second fix is app audit. Every app injecting JavaScript onto your storefront adds page weight, increases LCP, and blocks interactivity. Apps that load on every page but only function on specific pages (a chatbot on your product page, a countdown timer on your homepage) should be scoped to only fire where needed.
See your real LCP on mobile: Install Superspeed and within 24 hours you’ll see the exact revenue your store is losing to slow mobile pages — broken down by page, device, and session type.
Reason 2: Your Checkout Button Doesn’t Actually Work (Ghost Checkouts)
This is the most expensive problem nobody talks about.
A Ghost Checkout occurs when a shopper has clear purchase intent — they’ve added to cart, they’ve clicked “Checkout” — but the button doesn’t respond. Not because they changed their mind. Because your store’s browser is occupied.
Here’s the technical anatomy of a Ghost Checkout:
- A customer taps “Checkout” on their phone
- The browser’s main thread is currently occupied: a Facebook Pixel is firing, a chatbot is initializing, a upsell widget is calculating recommendations
- The tap registers in the input queue but the page can’t respond yet
- The customer taps again. Nothing. Again. Nothing.
- They close the tab. In your analytics, this looks like an abandoned cart. In reality, it was a failed transaction.
The metric Google uses to measure this is Interaction to Next Paint (INP) — the delay between any user input and the page visually responding. Google’s threshold for a “good” INP is under 200ms. For a Shopify store with multiple third-party apps firing simultaneously, real-world INP on the checkout button can exceed 800ms.
From a user psychology perspective, research from Nielsen Norman Group shows that 100ms feels instant, 1,000ms interrupts the user’s flow of thought. An 800ms delay on the “Checkout” button doesn’t just frustrate users — it makes them assume the site is broken.
The Math Is Brutal
According to Baymard Institute’s comprehensive checkout research, the average cart abandonment rate is 69.99%. Their research identifies “website errors/crashes” as one of the top reasons shoppers abandon checkout. But Ghost Checkouts are invisible — they register as normal cart additions followed by normal exits. Your analytics never tell you the button was unresponsive.
DTF Transfer Supply, a high-AOV B2B Shopify store, used Superspeed Sonar to analyze their checkout behavior. They were processing $82,023 in revenue over just a 14-day snapshot — but Sonar identified 955 “poor” performance sessions causing a $3,790 revenue leak in 14 days ($7,500+ monthly). These were real customers, with credit cards ready, who couldn’t complete their purchase because their session was too slow.
The Fix
The primary fix is JavaScript execution ordering. The browser’s main thread is single-threaded: it can only do one thing at a time. The goal is to ensure that by the time a customer clicks “Checkout,” the main thread is free to respond immediately.
Tactical fixes:
Defer non-critical scripts until interaction: Marketing pixels (Meta Pixel, TikTok Pixel, Google Tag) don’t need to fire the moment the page loads. Load them after a user’s first interaction to free up the main thread during initial page load.
Scope app scripts to specific pages: A chatbot script doesn’t need to load on your product pages. A review widget doesn’t need to initialize until the review section scrolls into view.
Audit your Shopify app list: Open your Chrome DevTools Performance tab while clicking “Add to Cart” and watch the flame chart. You’ll literally see which scripts are blocking the response.
Our Ghost Checkout recovery guide covers the complete technical breakdown, including which specific app types are most likely to cause this problem.
Detect Ghost Checkouts in your store: Superspeed’s Session Funnel Intelligence captures rage clicks — the most reliable signal of a Ghost Checkout — in real time, so you can identify exactly which pages and sessions are causing this problem.
Reason 3: Cumulative Layout Shift Is Making Customers Miss Your Buy Button
CLS (Cumulative Layout Shift) measures how much your page visually jumps as it loads. You’ve experienced this: you’re about to tap a button, and suddenly the page shifts and you accidentally tap something else entirely.
On Shopify stores, the most common cause is late-loading elements — a cookie consent banner that appears after the page renders, review widgets that inject themselves asynchronously, or Google Fonts that cause text reflow when they finally load.
The SEO implication (Google penalizes high CLS in rankings) is well-documented. But the conversion implication is what most guides miss.
CLS Directly Destroys Conversion Rate
When a buyer’s finger is headed toward “Add to Cart” and the button shifts 50px down because a review badge loaded late, one of three things happens:
- They tap the wrong element and get confused
- They tap the right element but the accidental click registers a different action (navigating away, opening a modal)
- They miss entirely, realize they need to try again, and — in a split-second decision on mobile — just close the tab
Each of these outcomes registers identically in your analytics: a “bounce” or “session ended without purchase.” You have no visibility into why.
According to Google’s Web Vitals team, the threshold for a “good” CLS score is under 0.1. Shopify stores using multiple review apps, chat widgets, and dynamic pricing apps routinely see CLS scores above 0.25 — a 2.5x violation that directly impacts both ranking and conversion.
The Fix
CLS fixes are almost always image-dimension related. The browser needs to know how much space to reserve for an element before the element loads. Without explicit dimensions, the browser renders the page without that space, then jumps when the element appears.
Immediate fixes:
Add
widthandheightattributes to all<img>tags, especially your hero image and product images. This allows the browser to reserve the correct space before the image downloads.Use
aspect-ratioCSS on containers that load dynamic content (review widgets, trust badge areas):aspect-ratio: 16/9;ensures the space is reserved even before content loads.Preload your custom fonts with
rel="preload"to eliminate font-swap CLS. When fonts load late and cause text reflow, every element positioned relative to that text shifts.Set explicit heights on cookie consent banners — or better, use a CSS
position: fixedapproach so the banner doesn’t push page content down when it appears.
Use our free Shopify CLS Explainer to understand which elements on your store are contributing most to your CLS score.
Reason 4: Your Analytics Are Lying to You About Conversion Rate
Most Shopify merchants look at their conversion rate and assume it’s accurate. It isn’t.
Here’s why. Standard Shopify analytics and Google Analytics 4 both undercount conversions by an average of 15–30% due to:
- iOS 17+ intelligent tracking prevention blocking GA4 cookies
- Ad blocker penetration (30–45% of desktop users have ad blockers installed)
- In-app browser limitations on Instagram, TikTok, and Facebook (more on this in Reason 6)
- Cross-device journeys that break session attribution
This means your conversion rate is almost certainly higher than Shopify reports — which makes the traffic-no-sales problem even more frustrating, because some of those “lost” conversions were actually completed on a device or browser your analytics can’t track.
But more dangerously, your analytics are also failing to capture the behavioral signals that predict abandonment before it happens. Standard analytics tells you where people went. It doesn’t tell you what they were trying to do when they left.
What Real Behavioral Data Looks Like
Rage clicks — when a user rapidly taps the same element multiple times — are the single most reliable predictor of imminent cart abandonment. They signal that a user is actively trying to complete an action and the page isn’t responding. Our data across thousands of Shopify stores shows that rage click events are followed by checkout abandonment 74% of the time within the same session.
Dead clicks — taps on non-interactive elements that look clickable — signal UX confusion. A customer who repeatedly taps your product image expecting a zoom function, and gets nothing, is a customer who’s questioning whether your store is legitimate.
Neither of these events appears in Shopify Analytics or GA4. They’re invisible to every analytics tool except behavioral intelligence platforms.
The Fix
The fix is a two-layer analytics approach:
Layer 1: Fix your attribution gap. Our guide on why GA4 misses Shopify conversions covers the server-side tracking approach that closes this gap. The short version: supplementing client-side analytics with server-side event capture (using Shopify Customer Events and your own backend) dramatically improves accuracy.
Layer 2: Add behavioral monitoring. Install real user monitoring that captures rage clicks, dead clicks, and ghost checkout events alongside your standard pageview and session data. These behavioral signals are the missing link between traffic and sales.
See what your customers are actually doing: Superspeed’s Friction Audit Dashboard captures rage clicks, dead clicks, and ghost checkout signals in real time — giving you the behavioral intelligence that standard analytics can’t provide.
Reason 5: Your Social Traffic Is Going Through a Broken Browser
This one is specific to merchants running Facebook, Instagram, TikTok, or Pinterest ads — which is most of you.
When a customer clicks your ad on Instagram and it opens in the Instagram in-app browser, they’re not in Safari or Chrome. They’re in a stripped-down WebView browser built into the Instagram app. And this WebView browser has several critical limitations that directly destroy your conversion rate:
Apple Pay and Google Pay don’t show up. The in-app WebView doesn’t support wallet payments. A customer who would instantly complete a purchase with Face ID on Safari now has to manually enter their 16-digit card number. Baymard Institute research shows that requiring manual card entry reduces checkout completion rates by up to 34% compared to wallet-payment checkout.
Facebook Pixel and third-party cookies are blocked or degraded. iOS 14+ restrictions on cross-app tracking mean your pixel can’t properly attribute the conversion even if it happens.
JavaScript execution is throttled. In-app browsers deprioritize JavaScript execution compared to native browsers, making your store feel slower and increasing the likelihood of Ghost Checkouts.
The scale of this problem: Our analysis of Shopify merchant data shows that 35–55% of social ad traffic arrives in an in-app browser on mobile. If your Instagram or TikTok campaigns feel unprofitable, the WebView problem might be silently killing conversions that would have completed in Safari.
The Fix
The solution is deep-linking to native browser from in-app browser. There are two approaches:
Option 1 (iOS/Android): Serve a landing page overlay when you detect WebView user agents (Instagram 262, FBAV, TikTok) with a prominent “Open in Safari / Chrome” button. This preserves Apple Pay and fixes the JavaScript execution issues.
Option 2 (Smart link solution): Use URL parameters that trigger automatic WebView escape — some approaches use document.write injection to present the native browser option only when a WebView is detected, without disrupting the experience for normal browser users.
Our guide on Instagram in-app browser conversion fixes covers the complete implementation with code examples.
Reason 6: Your Broken Links Are Losing Sales You Already Earned
Every time you delete a product, rename a collection, or change a URL, you potentially create a broken link. A broken link is a URL that returns a 404 error — “Page Not Found.”
Most merchants know broken links are bad for SEO. Fewer understand how directly they destroy revenue.
The Conversion Math
A user who encounters a 404 page has a 65–85% chance of leaving your store without visiting another page, according to our behavioral data. This is because a 404 creates a specific psychological response:
- The user was expecting a specific product or page
- They get a blank “Page Not Found” screen instead
- Their trust in your store drops immediately
- They navigate away — to Google, to your competitor, anywhere
If this was an organic search visitor who clicked a specific product link in Google, they’re gone. If it was a paid traffic visitor from a retargeting ad linking to a discontinued product, you’ve paid for a click that resulted in zero opportunity.
The compounding problem: Every external website linking to your 404 page is delivering zero SEO link equity to you. You’ve earned those links through PR, outreach, or organic mentions — and they’re actively wasted as long as the page 404s.
How Often Does This Happen?
More than you think. In our analysis of Shopify stores with product catalogs larger than 500 SKUs, we find that the average store has 12–18 active 404 URLs receiving real incoming traffic at any given time. For stores with seasonal product cycles, this number can spike dramatically each quarter when old products get removed.
The Fix
The fix is systematic 301 redirect management combined with continuous broken link monitoring.
A 301 redirect tells Google (and browsers) that the old URL has permanently moved to a new URL. This preserves 90–99% of the link equity from external links and immediately sends users to a relevant page instead of a dead end.
The challenge is knowing which URLs to redirect. You need both:
- Monitoring that detects when real traffic hits a 404 URL
- A way to set up the redirect without developer access
Use our Shopify Robots.txt Generator to ensure your crawl configuration is clean, and Superspeed’s Broken Link Win-Backs to monitor for 404s receiving real traffic and set up redirects from the dashboard.
Reason 7: Your Store Looks Trustworthy but Isn’t Converting — The Checkout Confidence Gap
There’s a final category of conversion problem that doesn’t show up in performance metrics at all. It’s the checkout confidence gap: visitors who reach your checkout page but abandon because they don’t trust that the transaction is safe, the product will arrive, or the business is legitimate.
Baymard Institute’s landmark research on cart abandonment found that 17% of US online shoppers have abandoned a cart in the past quarter because they “didn’t trust the site with their credit card information.” This is the second-highest specific abandonment reason after “extra costs too high.”
The Signals Customers Are Evaluating
When a first-time visitor reaches your Shopify checkout, they’re rapidly scanning for trust signals:
Security indicators:
- Is the URL https? (Visible in the browser address bar)
- Are there visible security badges near payment fields?
- Does the checkout look like it’s part of a legitimate business?
Social proof indicators:
- Review count and rating (is there any proof others have bought here?)
- Number of sales or customers served
- Real user testimonials with verifiable details (name, location, product)
Brand legitimacy indicators:
- A clear return policy linked directly from the checkout page
- A physical or business address somewhere on the site
- A phone number or live chat option for pre-purchase questions
Payment method indicators:
- Do you accept PayPal? (Research shows PayPal’s presence increases checkout completion by 28% among first-time buyers because PayPal offers buyer protection)
- Apple Pay / Google Pay? (Wallet payments signal the checkout is secure enough for the most security-conscious payment processors to integrate with)
The Fix
For most Shopify stores, the highest-leverage trust fixes are:
Add a trust badge block immediately below your “Checkout” button. Include: SSL secure badge, your return policy duration (e.g., “30-day free returns”), and a money-back guarantee statement. Baymard research shows these reduce abandonment by 10–20% on first-time purchases.
Make your review count visible on product pages and in your checkout’s breadcrumb. “3,412 happy customers” next to your product title is more powerful than five stars with no context.
Enable all wallet payment options (Apple Pay, Google Pay, Shop Pay) in your Shopify Payments settings. These should appear as the first payment options in checkout — not buried after credit card fields.
Add a sticky “Questions? Chat with us” bar to your checkout. Pre-purchase anxiety is often a question that goes unasked. A visible chat option eliminates the “but what if…” hesitation that causes abandonment.
The Integrated Diagnostic: How to Find Your Store’s Specific Problem
Reading through seven potential problems is useful. Knowing which one is your problem is what actually fixes your sales.
Here’s the diagnostic sequence we recommend:
Step 1: Get Your Real Performance Baseline (5 minutes)
Go to Google PageSpeed Insights and enter your primary product page URL. Ignore the Lighthouse score. Look at the “Field Data” section — this is CrUX data from real Chrome users. Check:
- Is LCP under 2.5s? (If not, Reason 1 is likely a major factor)
- Is CLS under 0.1? (If not, Reason 3 is causing accidental abandonment)
- Is INP under 200ms? (If not, Reason 2 is causing Ghost Checkouts)
Then use our free SEO Authority Checker to get your domain’s field CWV data in one view.
Step 2: Check Your Traffic Sources (2 minutes)
In your Shopify Analytics, look at which traffic sources have the lowest conversion rates. If Social is significantly lower than Search or Direct, Reason 5 (in-app browser) is likely a major contributor. Use our Revenue Leak Calculator to estimate the dollar impact.
Step 3: Audit Your Checkout Flow (10 minutes)
Manually go through your own checkout on a mid-range Android phone (or ask someone with one to do it). Time the button responses. Check if Apple Pay appears. Watch for layout shifts. Experience what your customers experience.
Step 4: Install Behavioral Monitoring
Standard analytics won’t catch Reasons 2, 3, or 4 in their full severity. Install Superspeed to see the exact dollar amount your store is losing to ghost checkouts, rage clicks, and performance failures — without guesswork.
Step 5: Check for Broken Links
Use our Broken Link Win-Backs dashboard to scan for 404 URLs receiving real traffic. Fix any with incoming links by setting up 301 redirects.
Case Study: What a Full Diagnostic Looks Like in Practice
Montezuma, a high-traffic Shopify store serving 47,875 unique visitors over a 14-day snapshot, used Superspeed Sonar to run exactly this diagnostic process.
The store was well-optimized by standard metrics — 56,000 out of 110,331 pageviews loaded as “Good” by CWV standards. But Sonar found a hidden mobile bottleneck: slower-loading mobile sessions were converting at a measurably lower rate than fast sessions.
By using the Revenue Intelligence dashboard to isolate the 4,896 “Poor” pages out of 110,000+, the Montezuma team identified a +6.3% potential revenue increase available by targeting only the specific high-impact pages generating poor experiences.
This is the key insight from all our case studies: you don’t need to make your whole store faster. You need to find the specific pages and session types that are losing sales, then fix those. The data tells you exactly where to look.
Frequently Asked Questions
I have good traffic but zero sales. Is my product just wrong for the market?
Possibly, but unlikely if you’re getting consistent traffic from relevant sources. Traffic to your product pages from product-related search terms signals real purchase intent. If traffic is converting at 0%, check: Are your prices competitive? Do you have trust signals (reviews, return policy)? Are you getting mobile traffic that’s hitting a slow page experience? Run the diagnostic sequence above before concluding the product is wrong.
My Shopify conversion rate shows 2% — is that good or bad?
The Shopify average conversion rate is approximately 1.3–1.4%, so 2% is above average. But “average” isn’t the benchmark — your potential rate is. If your fast-loading sessions convert at 4% and your slow sessions convert at 1%, fixing your slow sessions doubles your effective conversion rate. Our Revenue Leak Calculator can estimate what you’re leaving on the table.
I’m getting add-to-carts but no checkouts. What’s happening?
This is the classic Ghost Checkout signal (Reason 2). Your buyers are reaching checkout intent but the checkout button or flow is failing them. Check your INP score on product and cart pages, audit your third-party app scripts for main-thread blocking, and install behavioral monitoring to detect rage clicks at the checkout step.
Does Shopify’s built-in checkout affect my conversion rate?
Shopify’s native checkout is actually one of the fastest and most optimized checkout experiences available — Shopify has invested heavily in it. The conversion problems typically come from what’s around the checkout: the speed of the product and cart pages leading up to it, the payment options displayed, the trust signals visible, and how many JavaScript scripts are blocking the checkout button from responding.
My Instagram ads have good ROAS in the Facebook dashboard but I can’t see it in Shopify. What’s happening?
This is Reason 4 (analytics tracking gaps) combined with Reason 5 (in-app browser). Instagram’s in-app browser blocks cross-site tracking, so many conversions that happen through Instagram ads don’t get attributed back to the Facebook Pixel. Additionally, users whose Apple Pay doesn’t show up in the Instagram WebView may abandon, making your ad’s true performance worse than it would be if they’d opened in Safari. Fix: server-side tracking + deep-linking to native browser for Instagram traffic.
The Bottom Line
Traffic without sales isn’t a marketing problem. It’s almost always a performance, behavioral, or trust problem that can be measured, diagnosed, and fixed.
The seven reasons covered in this article — mobile speed, ghost checkouts, layout shift, analytics gaps, broken links, in-app browser failures, and checkout confidence — account for the vast majority of the conversion gap we see across thousands of Shopify merchants.
The good news: every single one of these is fixable, and most can be diagnosed with data you already have access to.
Start your diagnosis:
- SEO Authority Checker — real Core Web Vitals for your domain from Google’s database
- Revenue Leak Calculator — estimate what your current load time is costing you in monthly revenue
- LCP Preload Generator — fix your #1 mobile speed issue in 10 minutes
- Install Superspeed → — see the exact revenue your store is losing to each of the 7 failure modes, and fix the right problem first
Related reading: