


If you run a Shopify store, chances are you’ve run your URL through Google PageSpeed Insights (PSI). You stared at a spinning wheel, only to be presented with a large, intimidating red circle and a score of 35/100. Panic sets in. You immediately start uninstalling apps, compressing images, and demanding your developers “fix the Lighthouse score.”
But here is the million-dollar secret that performance engineers know, and most merchants don’t: That Lighthouse score is a synthetic lab test. It does not reflect what your actual customers are experiencing, and it is a terrible predictor of your conversion rate.
In the world of web performance, there is a massive, fundamental divide between Synthetic Testing (Lab Data) and Real User Monitoring (Field Data/RUM).
If your goal is to pass Google’s Core Web Vitals to rank higher in SEO, or if your goal is to increase your Shopify conversion rate, optimizing for a synthetic Lighthouse score is often a waste of time and money. You need to be optimizing for Real User Monitoring.
In this comprehensive 2,000+ word guide, we will break down exactly why Lighthouse scores are misleading, how Lab Data differs from Field Data, what the Chrome User Experience Report (CrUX) is, and why every serious Shopify brand needs Real User Monitoring telemetry.
Part 1: The Illusion of the Google Lighthouse Score
Let’s start by demystifying the most misunderstood metric in e-commerce: The Google Lighthouse Performance Score.
What is Google Lighthouse?
Google Lighthouse is an open-source, automated tool for improving the quality of web pages. When you run a test on PageSpeed Insights, GTmetrix, or WebPageTest, the engine powering the results is almost always Google Lighthouse.
Lighthouse runs in a Lab Environment. This means it is a synthetic, simulated test.
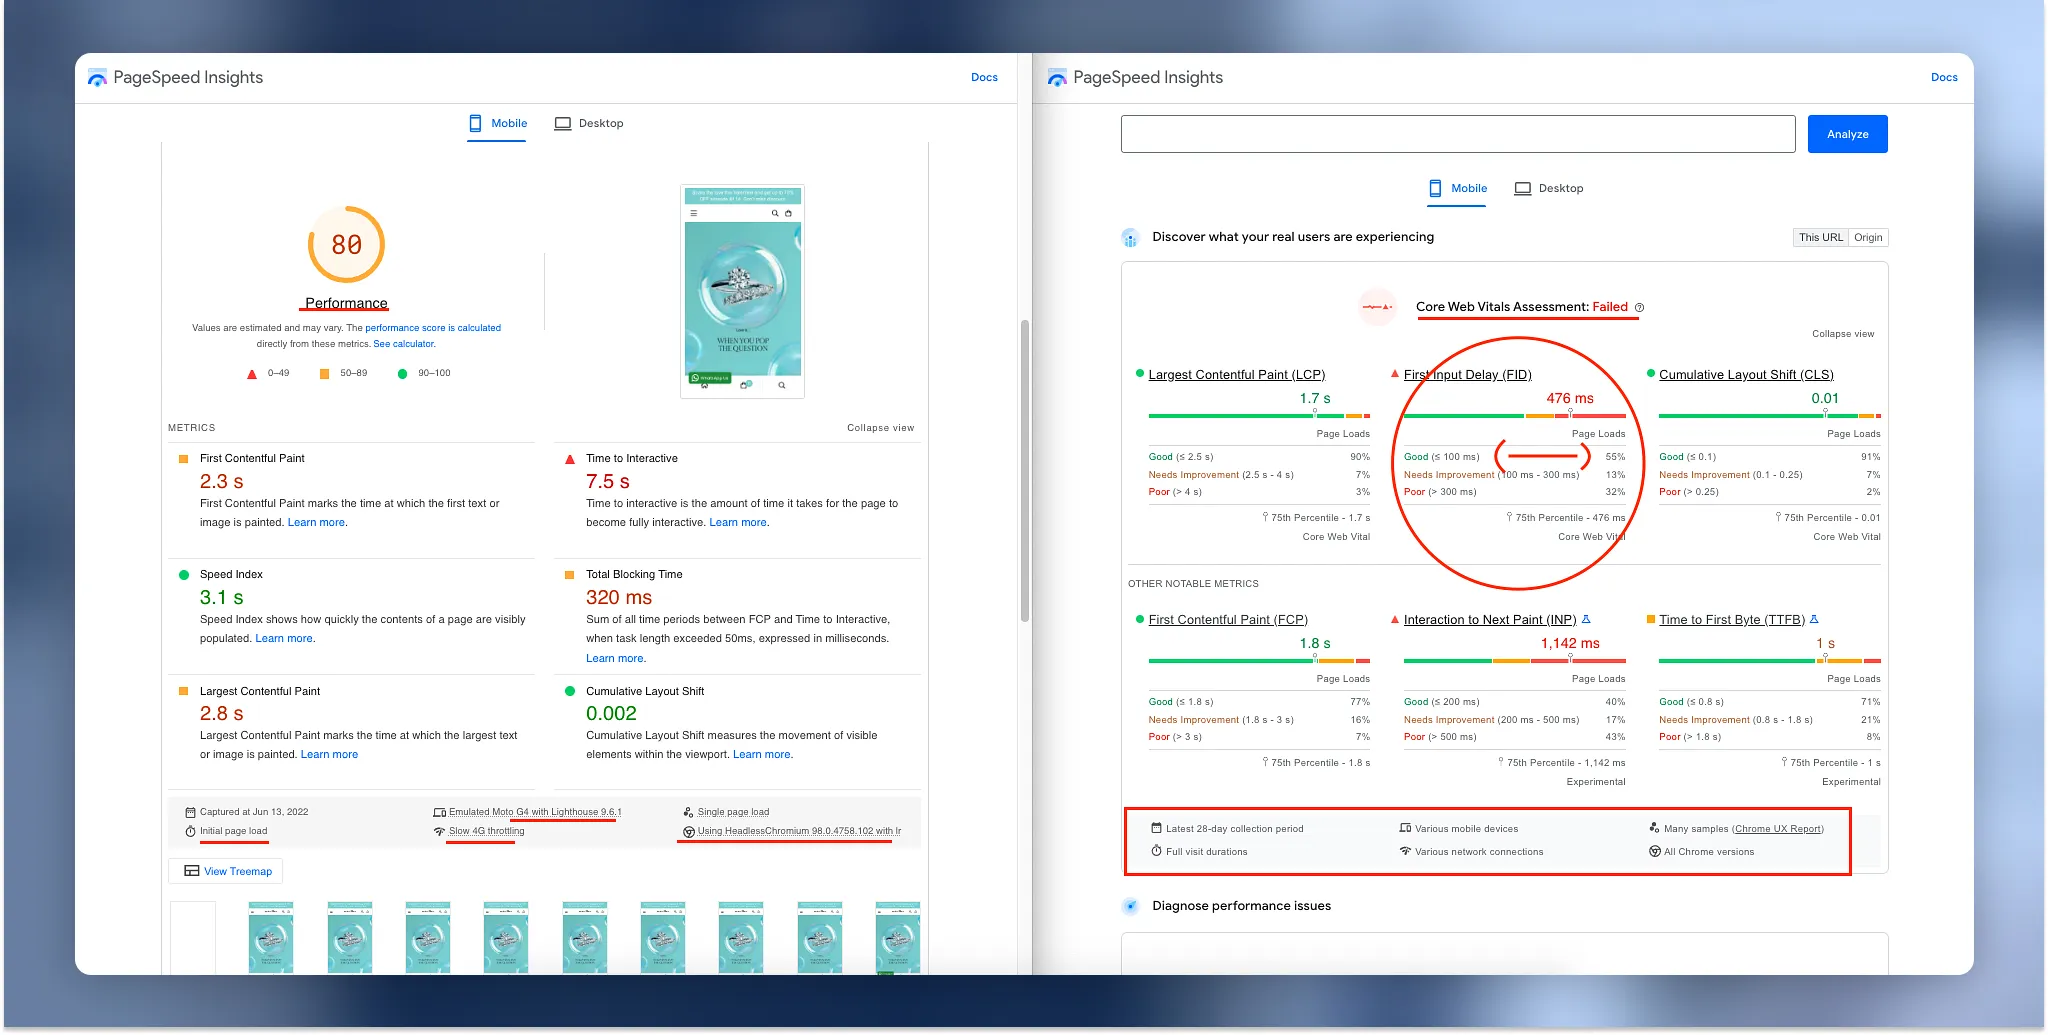
When you click “Analyze” on PageSpeed Insights, a Google server somewhere in the world spins up a headless Chrome browser. It then purposefully degrades its own capabilities. It throttles the CPU by 4x to simulate a cheap, low-end mobile phone from 5 years ago. It chokes the network connection down to a simulated, spotty 3G mobile network. It then loads your Shopify homepage exactly once, records how long it takes, and assigns you a score out of 100.
Why Lab Data is Fundamentally Flawed for E-Commerce
Lab Data is fantastic for developers who are trying to debug a specific line of JavaScript. But for a Shopify merchant trying to understand their customer experience, it is completely divorced from reality.
Here are the primary reasons why your Lighthouse score is misleading:
- It simulates the absolute worst-case scenario. While it is noble to test on a simulated Moto G4 phone on a slow 3G connection, this does not represent the demographic of most premium Shopify brands. If you are selling high-ticket luxury apparel, 85% of your mobile traffic is likely coming from modern iPhones on high-speed 5G or Wi-Fi connections. Optimizing your entire store for a 3G Android user who will never buy your product is a misallocation of resources.
- It only tests the first, cold load. Lighthouse visits your homepage as a brand-new user with an empty browser cache. It records the load time, and then stops. But in reality, e-commerce shopping is a multi-page journey. A user lands on the homepage, clicks a collection, clicks three different products, and goes to checkout. On the 2nd, 3rd, and 4th clicks, their browser has cached your CSS, JavaScript, and images. Those subsequent page loads are lightning-fast. Lighthouse completely ignores the cached journey, focusing entirely on the initial cold hit.
- It cannot measure user interaction. The most critical part of an e-commerce store is interactivity—clicking “Add to Cart,” opening the mobile menu, or expanding a product accordion. Lighthouse is a robot. It does not scroll down, it does not click buttons, and it does not type into input fields. Therefore, it cannot accurately measure Interaction to Next Paint (INP) or First Input Delay (FID), which are massive indicators of user frustration.
- It varies wildly by server location. If you run a Lighthouse test from a server in London on a Shopify store hosted in North America, the network latency of traveling across the Atlantic Ocean will destroy your TTFB (Time to First Byte) score. If you run it from a server in New York, the score will jump 20 points. Your real users don’t all live next door to a Google testing server.
The Proof: 100/100 Doesn’t Mean You Pass
Philip Walton, a prominent Google engineer, published a profound analysis challenging the web performance community. He analyzed millions of websites and found a staggering conclusion:
“Almost half of all pages that scored 100 on Lighthouse didn’t meet the recommended Core Web Vitals thresholds.” — Philip Walton
How is this possible? Because a stripped-down webpage might load instantly in a Lab Test (scoring 100/100), but when real humans visit it, they might experience layout shifts as they scroll, or the “Add to Cart” button might freeze when they try to click it (failing Field Data).
Conversely, we have analyzed over 1.3 million Shopify pageviews using Superspeed, and we frequently see the opposite:
A Shopify store with a Lighthouse performance score of 45/100 can easily have passing Core Web Vitals and a massive conversion rate, because their real-world users are on fast iPhones.
Part 2: Field Data and the Chrome User Experience Report (CrUX)
If Lab Data is synthetic and misleading, what is the alternative? The answer is Field Data.
What is Field Data?
Field Data is performance data collected from real human beings loading your website on their real devices over their real network connections.
When Google talks about “Core Web Vitals” and uses speed as an SEO ranking factor, they do not use your Lighthouse score. They use Field Data.
How Google Collects Field Data: The CrUX Database
Google collects Field Data through the Chrome User Experience Report (CrUX).
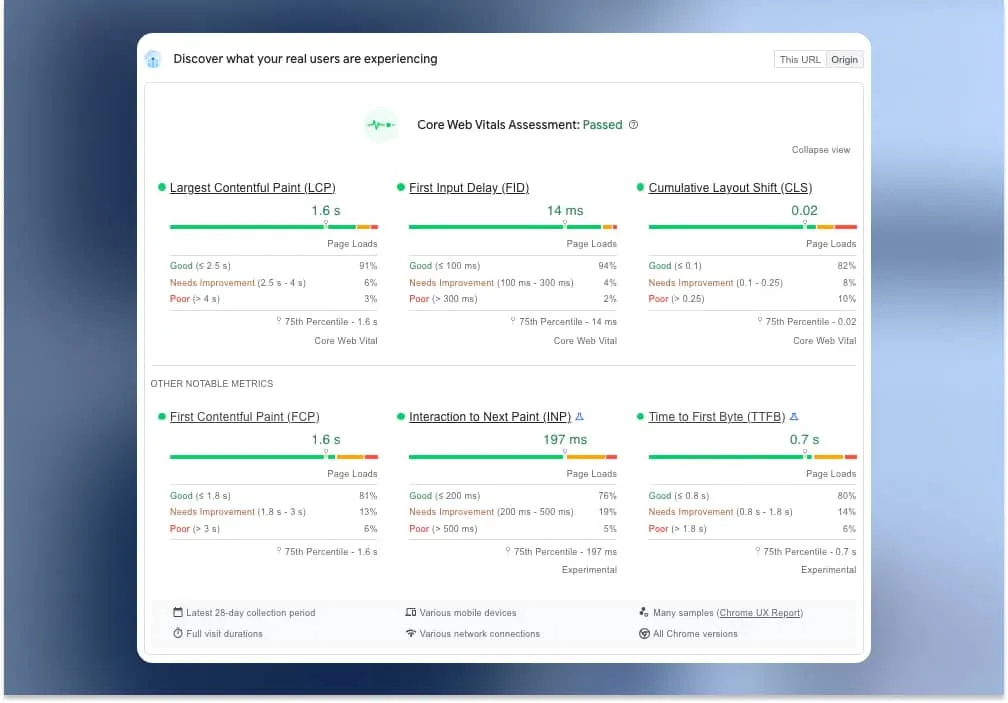
If a user visits your Shopify store using the Google Chrome browser, and they are logged into their Google account with usage statistic reporting enabled, their browser silently records exactly how long it took your site to load. It records the Largest Contentful Paint (LCP), the Cumulative Layout Shift (CLS), and the Interaction to Next Paint (INP).
The Chrome browser then secretly sends this data back to Google’s massive CrUX database. Google aggregates this data over a rolling 28-day period.
This aggregated 28-day Field Data is your official Core Web Vitals score. This is the exact metric that dictates whether your site gets an SEO boost or an SEO penalty.
The Problem with Google’s CrUX Data for Merchants
While CrUX data is the “source of truth” for SEO, it is incredibly frustrating for Shopify merchants and developers to rely on for day-to-day optimization:
- The 28-Day Lag: CrUX data is a 28-day rolling average. If you install a new, heavy Shopify app today that destroys your page speed, you won’t see the drop in your Google Search Console for almost a month. By then, the damage is done. Conversely, if you spend a week aggressively optimizing your theme and fixing all your speed issues, your Google Search Console will still say you are “Failing” for the next 28 days until the old, slow data flushes out of the average.
- The Traffic Threshold: Google only collects and displays CrUX data if your specific URL receives a statistically significant amount of traffic. If you are a smaller boutique or a B2B store with lower traffic volume, Google will simply say “Not enough data available” in Search Console. You will be flying completely blind.
- Lack of Diagnostics: CrUX tells you that your site is slow, but it doesn’t tell you why. It will tell you that your LCP is 4.5 seconds, but it won’t tell you which image was the LCP element, or which third-party script delayed it. You cannot debug a problem if you don’t know the root cause.
Part 3: Real User Monitoring (RUM) — The Ultimate Solution
To bridge the gap between instantaneous-but-fake Lab Data and real-but-lagging CrUX data, enterprise e-commerce brands rely on a technology called Real User Monitoring (RUM).
What is Real User Monitoring?
RUM is the deployment of a lightweight, asynchronous telemetry script on your Shopify store. Just like Google Analytics tracks what users click on, a RUM script tracks how fast the page responds when they click it.
Every time a user visits your store, the RUM script records their individual LCP, CLS, TTFB, and INP metrics using the browser’s native Performance APIs. It then sends this data to a dashboard in real-time.
Why Every Shopify Store Needs RUM
RUM represents the holy grail of web performance. It gives you the accuracy of Field Data with the instant feedback of Lab Data.
Here is why RUM outclasses both Lighthouse and Google CrUX:
1. Instant Real-Time Feedback
If you push a code change to your Shopify theme at 2:00 PM, a RUM dashboard will show you the exact impact on your Core Web Vitals by 2:05 PM. You don’t have to wait 28 days for Google to update its database. If a new app breaks your mobile menu interactivity, you will know immediately and can roll back the change before it impacts your daily revenue.
2. 100% Traffic Coverage
Unlike Google CrUX, which only tracks users on Google Chrome, a good RUM solution tracks users on Safari, Firefox, Edge, and mobile in-app browsers (like the Instagram WebView). Safari accounts for massive portions of mobile Shopify traffic (often 50-60% on iOS devices). If you are only looking at CrUX data, you are completely blind to half of your revenue-generating audience.
3. Deep Segmentation and Diagnostics
Lighthouse gives you a single score. RUM gives you a granular database. With RUM, you can segment your performance by device type, browser, country, and network speed.
- Is your LCP slow because your code is bad, or is it slow because 20% of your traffic is coming from rural areas with 3G connections?
- Does your site freeze (poor INP) only on Safari iOS 16?
- Did a specific marketing campaign from TikTok drive traffic that bounced due to slow loading?
RUM allows you to answer these questions with mathematical certainty.
4. The Revenue Correlation (Revenue Leak)
This is the most critical advantage of RUM. Because RUM tracks real sessions in real-time, it can be correlated directly with your Shopify checkout data.
With synthetic Lab Data, you are guessing that a higher score leads to more sales. With RUM telemetry, you can prove it. You can track exactly how the conversion rate fluctuates based on the latency experienced by the user.
If a user experiences an LCP of 1.5 seconds, they might convert at 3.2%. If a user experiences an LCP of 4.0 seconds, they might convert at 1.1%.
By tracking millions of RUM sessions and correlating them with checkout success, platforms like Superspeed can calculate your exact Revenue Leak: the precise dollar amount you are losing to slow page loads. This transforms web performance from a technical chore into a measurable financial strategy.
Part 4: How to Shift Your Performance Strategy
If you have been obsessively chasing a 100/100 Lighthouse score on PageSpeed Insights, it is time to pivot your strategy. You are optimizing for robots, not human buyers.
To build a high-converting, SEO-dominant Shopify store in 2026, follow this modern performance playbook:
Step 1: Stop Stressing Over the Mobile Lighthouse Score
Accept that the mobile Lighthouse test is simulating an outdated, throttling environment. If your mobile score is a 45, but your actual mobile conversion rate is strong, do not rip out your theme code to appease the robot.
Step 2: Use Lab Data Only for Spotting Obvious Errors
Lighthouse is still a useful tool for catching glaring mistakes. Use it to ensure you don’t have massive 5MB uncompressed images, to check that you have basic lazy-loading implemented, and to ensure you aren’t blocking the main thread with an obvious syntax error. Treat it as a linter, not a grading system.
Step 3: Implement Native Shopify RUM Telemetry
You need visibility into your real users. You cannot rely on the 28-day lag of Google Search Console.
Historically, implementing RUM required injecting heavy third-party scripts that paradoxically slowed down the site they were supposed to be measuring. However, modern platforms like Superspeed utilize Shopify’s Customer Events API (Web Pixels). This allows RUM telemetry to run in an isolated, secure sandbox. It captures high-fidelity session data and Core Web Vitals with a zero-script footprint on your main rendering thread.
Step 4: Focus on Interaction to Next Paint (INP)
For years, the performance community focused entirely on visual load times (how fast the image appears). But data shows that users are actually much more frustrated by unresponsiveness.
If a user clicks “Add to Cart” and the button doesn’t immediately react, they will click it again (a Rage Click). They will assume the site is broken and abandon the checkout. Google has recognized this, which is why they replaced First Input Delay (FID) with Interaction to Next Paint (INP) as a Core Web Vital.
Use RUM to track the specific UI elements (like sticky headers, variant selectors, and mobile menus) that are causing JavaScript deadlocks and failing the INP metric for your real users.
Step 5: Prioritize Fixes Based on Revenue Impact
When you have RUM data correlated with your cart conversions, you no longer have to guess what to fix first.
If your blog pages have terrible LCP times, but your product pages are lightning fast, your overall “site speed average” might look bad. But from a revenue perspective, the product pages are what matter.
RUM allows you to look at your traffic segments (e.g., “Mobile Safari Users in the US”) and see exactly how much revenue is leaking due to poor performance in that specific cohort. You can then allocate your development budget to fix the exact bottlenecks that are choking your cash flow, guaranteeing a positive ROI on your optimization efforts.
Conclusion: Reality > Simulation
E-commerce is a hyper-competitive landscape where milliseconds dictate profit margins. You cannot afford to make technical decisions based on synthetic simulations that don’t represent your actual target demographic.
Lab Data (Google Lighthouse) is a developer’s debugging tool. Field Data (Google CrUX) is an SEO ranking factor. But Real User Monitoring (RUM) is the operational intelligence required to run a scalable, high-converting Shopify store.
Stop optimizing for robots. Start tracking exactly how your human customers experience your brand, and fix the friction points that are quietly draining your revenue.